docs.semactic › Semactic Features
Log Analyzer
The Log Analyzer reads your web server's access logs to show how search engine bots, AI bots and other crawlers really visit your site: which pages they request, how often and with which HTTP response codes. Use it to spot the pages bots ignore, the errors they hit, and to check that AI crawlers can reach your content.
Open it from Log Analyzer in the left sidebar. The page is available to Admin users and above. Log files belong to the project, so they are shared by every market of that project. Only bot visits are analysed: human visitors are not identified.
The page has four tabs: Dashboard, Bots and AI, Crawler and Settings.
Import your logs
Until a log has been imported, the page shows Let's start with your logs with two buttons: Upload a file and Connect a server. You can also import logs at any time from the Data sources section, at the bottom of the Bots and AI tab.
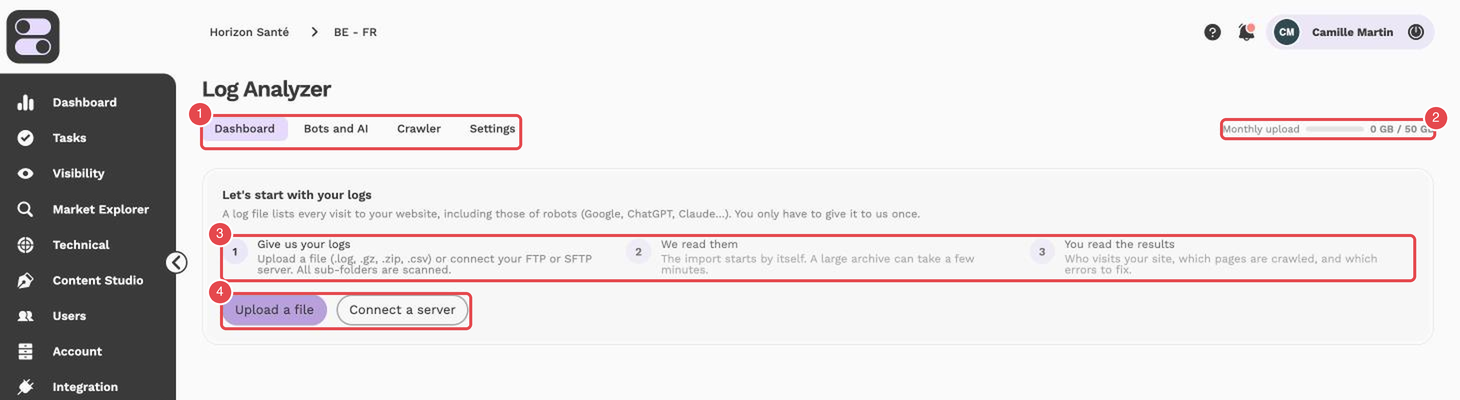
What the numbers show:
- Tabs — Dashboard, Bots and AI, Crawler and Settings.
- Monthly upload — the volume of logs used this month, out of the volume available.
- The three steps — give us your logs, we read them, you read the results.
- Upload a file and Connect a server — the two ways to import your logs. The formats read are Apache, Nginx, IIS and CSV, with or without compression.
Upload a file
Open the upload
From Upload a file on the start screen, or from the Data sources section at the bottom of the Bots and AI tab, open Upload a log file.
Add your file
Drag the file into the drop zone, or click browse your files. Accepted formats: .log, .txt, .csv, .gz and .zip. It is an access log from your web server or CDN (Apache, Nginx, IIS, Cloudflare…), one visit per line.
Wait for it to be read
A progress bar shows the upload, then the number of lines read. The file is ready when its status reads Done. An upload is a one-off: nothing is connected to your server.
[!TIP] Import logs covering at least several weeks: crawl trends and period comparisons only become meaningful with enough history.
Connect a server (data sources)
The Data sources section, at the bottom of the Bots and AI tab, lets Semactic fetch your new logs on its own. It is always displayed; without a source it reads No source connected.
Add a source
Click Add a source.
Choose the connection type
Choose Link (a URL pointing to the log file), FTP or SFTP (server, port, username, password and folder). FTP can be secured with the FTPS option; SFTP is always encrypted. In the advanced options you can Keep only paths containing certain words or Ignore paths containing certain words (separated by commas).
Set the frequency
Choose Every day, Every week or Every month, then save. Semactic connects, lists the log files and reads them one by one; progress is shown at the top of the dashboard.
Each source shows the date of its last import and the next one. Import now looks for new files right away, Pause and Resume stop and restart the automatic imports, and you can edit or delete the source (data already imported is kept).
[!NOTE] Each project can import up to 50 GB of logs per calendar month, the same on every plan; it is shown as Monthly upload and resets on the 1st of the month. The files uploaded or fetched from a server count towards it, except failed files. Deleting a file does not give its volume back. Once the limit is reached, uploads and imports resume on the 1st of the month. If your free trial has ended, importing logs is locked until you choose a paid plan.
Manage imported files
The Imported files section of the Settings tab lists, for each file: its name, status (Uploading, Waiting, Being read, Done or Failed), the period covered, its size, its number of lines, its bot visits and its import date.
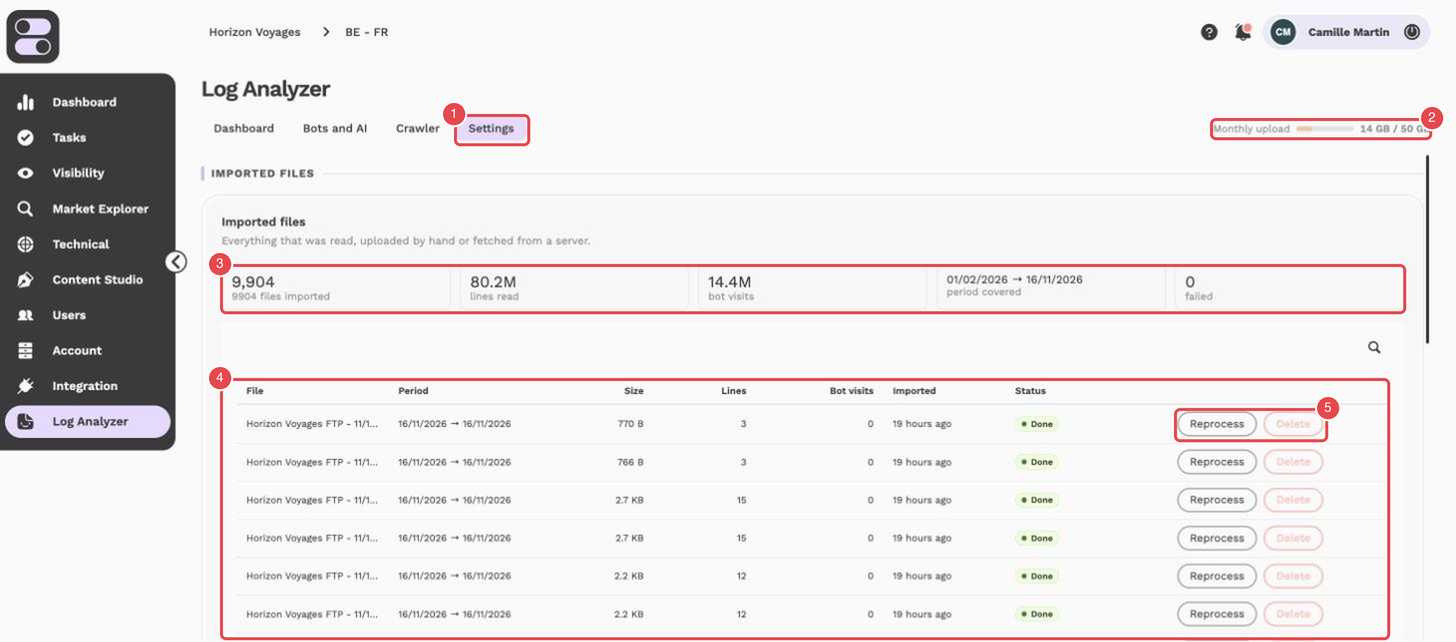
What the numbers show:
- Settings tab — the tab is selected.
- Monthly upload — the volume of logs used this month, out of the volume available.
- Imported files summary — the number of files imported, lines read, bot visits, the period covered and the number of files that failed.
- Files table — one line per file: period, size, lines, bot visits, import date and status.
- Reprocess and Delete — the buttons at the end of each line.
Until a first import, this section reads No file imported yet. The How it works section, lower on the page, recalls the three steps: you give your logs, we read them automatically, you read the results.
- Reprocess re-reads a file from its stored copy and replaces its previous lines, for example after a failure.
- Delete removes the file and its lines from the statistics.
- If some files could not be imported, a banner at the top of the page says so: their visits are missing from the figures until they are imported again (Reprocess).
Choose the period and filters
The Dashboard, Bots and AI and Crawler tabs follow the period chosen in the top bar.
| Control | Purpose |
|---|---|
| Periods | Choose Last day, Last 7 days, Last 30 days, Last 90 days, This month, Last month, All the data or a Custom period. Only dates covered by your logs can be selected. |
| Comparison | When your logs go back far enough, figures are compared with the previous period of the same length (Compared with…). If the two periods are not the same length, the change is calculated per day. |
| Family | Limits the analysis to one bot family: Search engines, AI bots, Social networks, SEO tools or Other bots. |
| HTTP code | Clicking a code in Response codes filters the page on that code. Active filters are listed under Active filters: and can be removed one by one. |
Dashboard
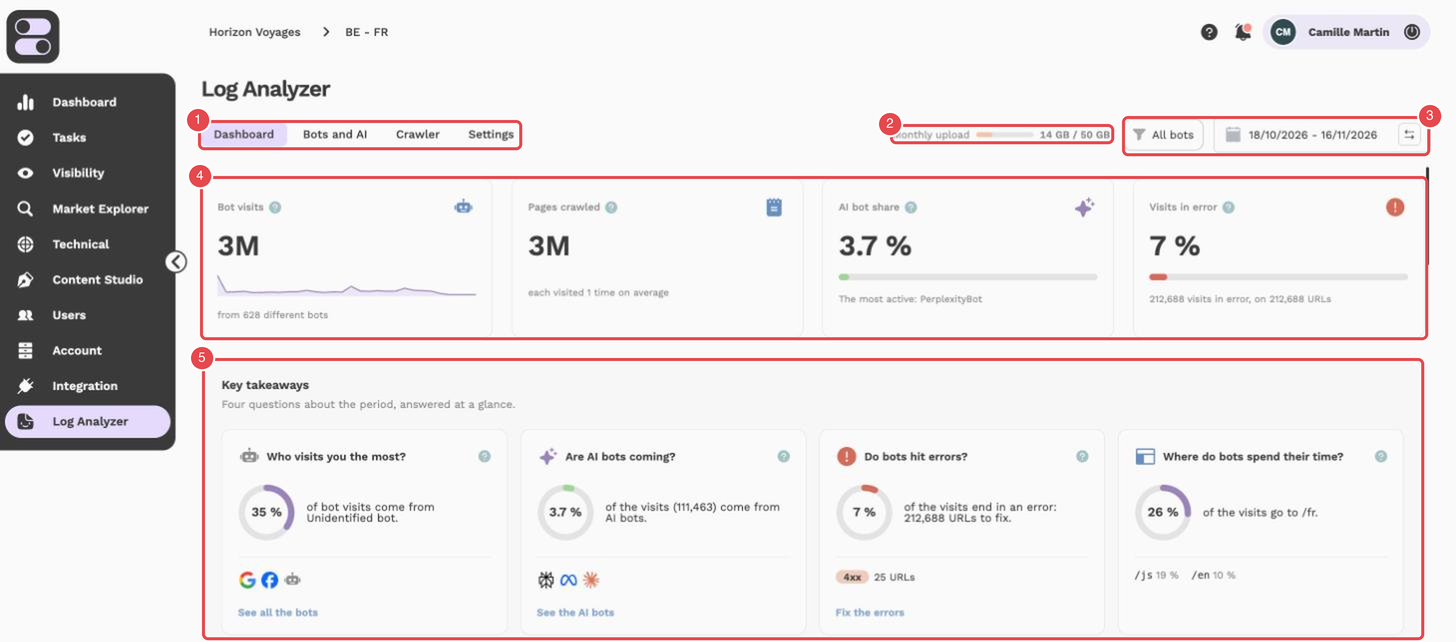
What the numbers show:
- Tabs — Dashboard, Bots and AI, Crawler and Settings.
- Monthly upload — the volume of logs used this month, out of the volume available.
- All bots filter and period — the bot family filter and the period displayed.
- Indicator cards — Bot visits, Pages crawled, AI bot share and Visits in error.
- Key takeaways — the four questions: Who visits you the most?, Are AI bots coming?, Do bots hit errors? and Where do bots spend their time?
- Four questions: Who visits you the most?, Are AI bots coming?, Do bots hit errors? and Where do bots spend their time?, each answered at a glance.
- Indicators: Bot visits, AI bot share, Visits in error and Pages crawled, compared with the comparison period.
- Bot visits over time: the number of visits per day for each bot family, as Visits or Share of the day. A curve needs at least three days.
- Response codes: what your site answers (Success, Redirects, Page not found, Server error). Click a row to filter the whole page.
- Errors to fix: the pages that answer bots with an error, most costly first, with a priority (High, Medium, Low) and how to fix them.
- Most crawled parts of the site: the first folder of the URL by number of bot visits. Click a section to see its most visited pages.
- Detailed log: Show the log opens the raw log lines (date and time, URL, bot, category, code, duration).
Bots and AI
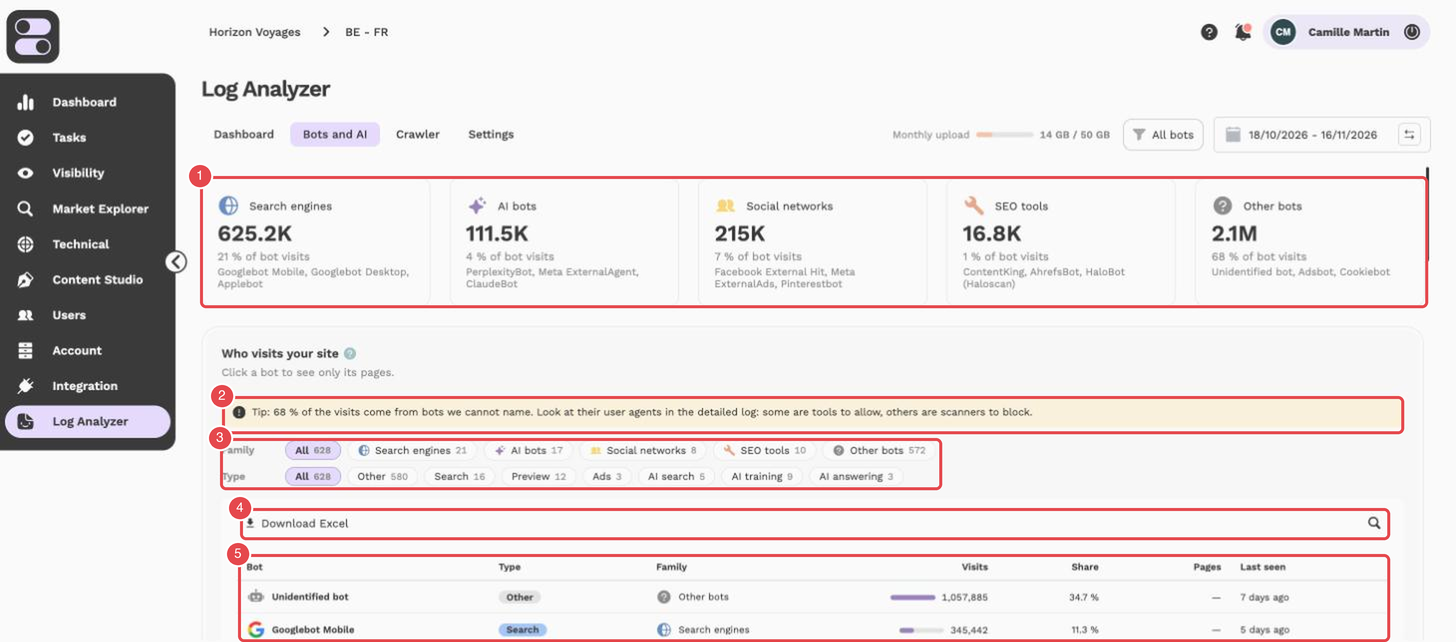
What the numbers show:
- Bot families — one card per family: Search engines, AI bots, Social networks, SEO tools and Other bots, with their share of bot visits.
- Tip — a banner that appears when part of the visits comes from bots that could not be identified; their user agents are in the detailed log.
- Family and Type filters — limit the list to one family or one type of bot.
- Download Excel and search — export the list, or search for a bot.
- Bots table — for each bot: type, family, visits, share, pages and last visit.
- Bot families: Search engines, AI bots, Social networks, SEO tools and Other bots, with their share of bot visits.
- Who visits your site: the list of detected bots (visits, pages, URLs, share, change, last visit). Bots are recognised by their signature (User-Agent); an unknown bot appears in Other bots. A New badge flags a bot that was absent in the previous period. Click a bot to see only its pages.
- Pages crawled: the pages seen by the selected bots, with their visits, change, response codes and last visit. Tick pages to create a task, or click a page to see its details.
- Data sources: at the bottom of the tab, where you connect a server or upload a log file.
Crawler
The Crawler tab compares what bots visited with what the Semactic crawler found on your site:
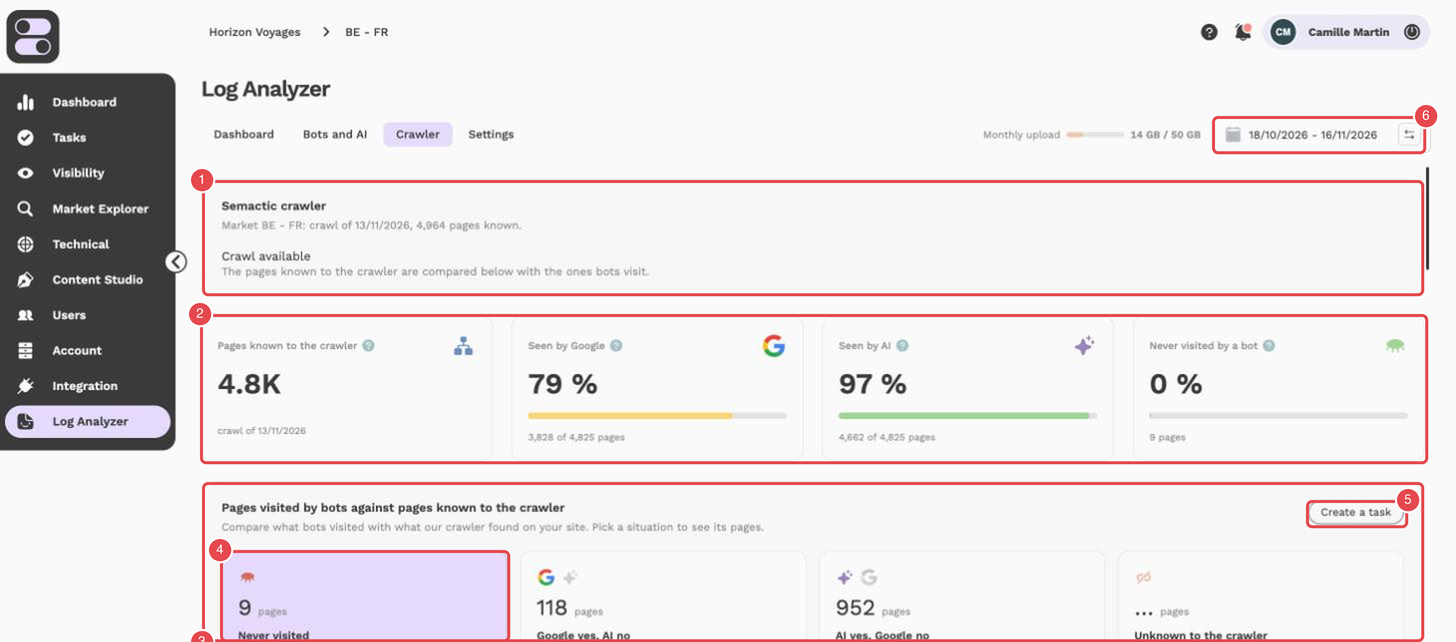
What the numbers show:
- Semactic crawler status — the market, the date of the crawl and the number of pages known.
- Indicator cards — Pages known to the crawler, Seen by Google, Seen by AI and Never visited by a bot.
- Pages visited by bots against pages known to the crawler — the comparison, with one tile per situation.
- Selected situation — here Never visited; select a situation to see its pages.
- Create a task — the button to create a task from this comparison.
- Period — the period displayed.
- Pages known to the crawler, Seen by Google, Seen by AI and Never visited by a bot;
- Pages reached, level by level: how deep Google and AI bots go in the site structure (the level is the number of folders in the URL);
- Pages visited by bots against pages known to the crawler: choose AI yes, Google no, Google yes, AI no, Never visited or Unknown to the crawler to see the pages concerned and what to do.
If the comparison says it is being prepared, come back in a few minutes. The market must have been crawled and logs must be imported for the comparison to show.
[!NOTE] Exporting server logs requires access to your hosting. If you do not have it, ask your development team or your host for your site's access logs.